Chapter 1. Descriptive Statistics: Measures of Central Tendency
 Mode
Mode
Mode
The mode of a distribution is the most frequently occurring score or category.
When looking at a frequency distribution graph, the mode corresponds to the peak of the distribution.
Calculating the Mode in Excel
To calculate the mode in Excel, make use of the following function:
MODE(array)
- array: The array or cell range of numeric values for which you want to calculate the mode.
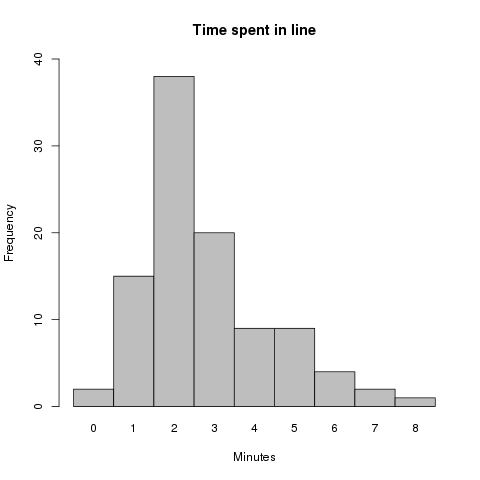
#\text{Mode} = 2#
The mode of a distribution is the score with the highest frequency.
When looking at a histogram, the mode corresponds to the peak of the graph.
In this case, the peak of the graph lies at a score of #2#, with an observed frequency of #38#.
#\phantom{0}#
A distinctive characteristic of the mode is that it is a measure of centrality that can be calculated for every type of data. In fact, for nominal data, the mode is the only appropriate measure of central tendency available.
\[
\begin{array}{c|cccc}
&\text{Nominal}&\text{Ordinal}&\text{Interval}&\text{Ratio}\\
\hline
\text{Mode}&\green{\text{Yes}}&\green{\text{Yes}}&\green{\text{Yes}}&\green{\text{Yes}}\\
\end{array}
\]
Sometimes a distribution will have more than one mode. When a distribution has two modes, it is said to be bimodal. Strictly speaking, this only occurs when two scores or categories have the exact same highest frequency. In practice, however, the term mode is used more loosely to describe scores with a relatively high frequency.
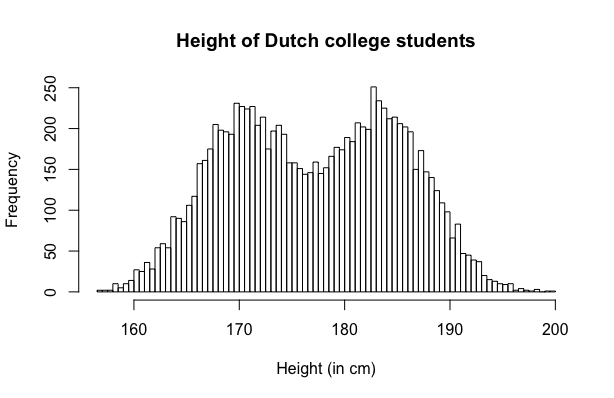
A bimodal distribution may be indicative of the presence of two distinct subsets within the distribution. Take a look at the histogram below which is the result of measuring the height of #10\,000# Dutch college students. Cleary, this is a distribution with two peaks, one around #171\,\text{cm}# and another around #184\,\text{cm}#. In this case, the first peak corresponds to the female students, whereas the second peak corresponds to the male students.

A distribution with more than two modes is called multimodal. It is common practice to not report all the modes of a multimodal distribution since it makes little sense to have three or more typical values of a distribution.
If all scores in the distribution occur with the same frequency, the distribution is said to have no mode.
#\phantom{0}#

Or visit omptest.org if jou are taking an OMPT exam.


